
Statistics
Statistics shows usage statistics and charts for your organisation’s printing. This is the analytics page that was previously called Dashboard — the page and its web address are unchanged; only the menu label has changed.
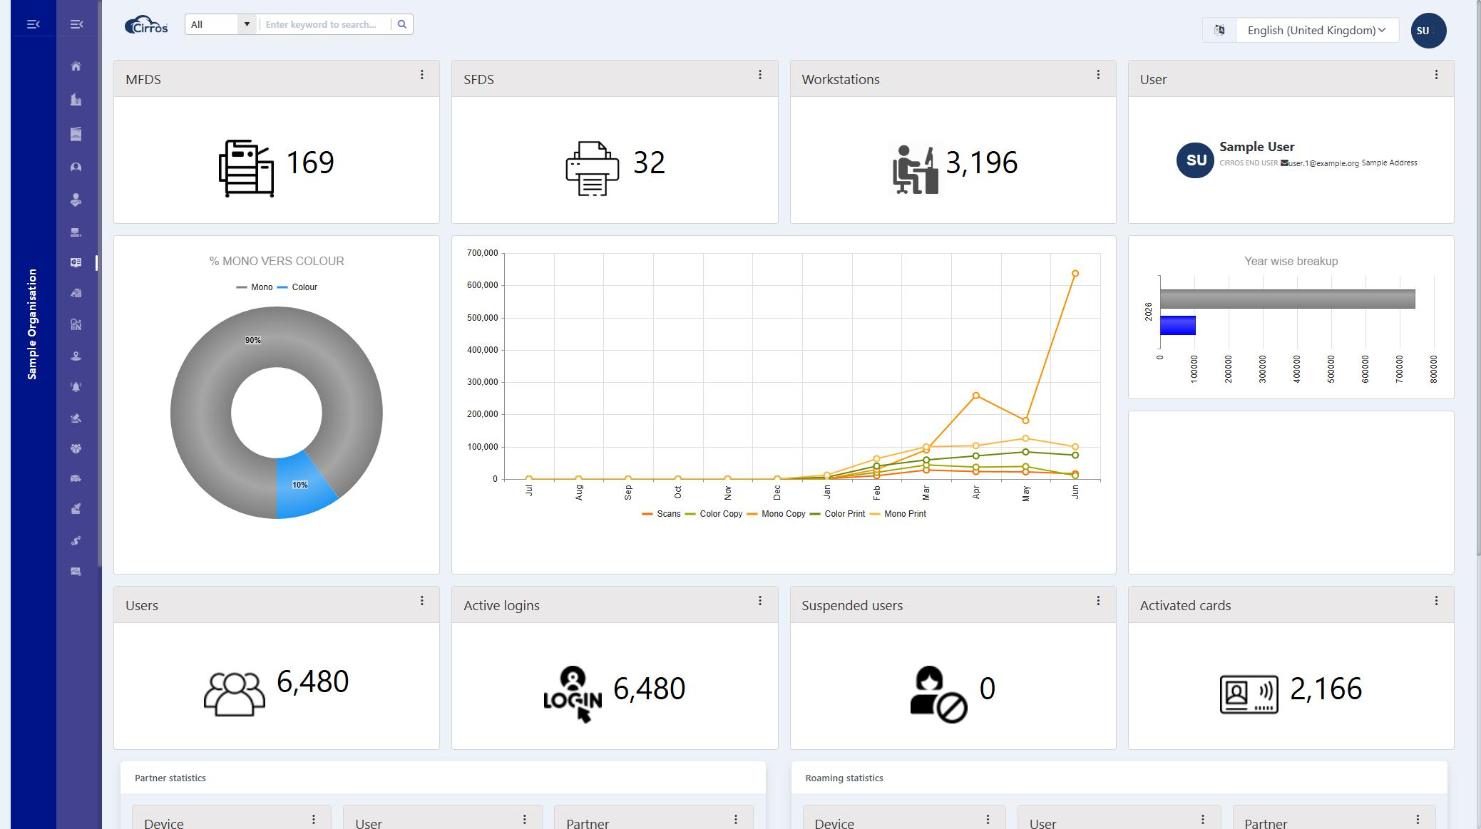
At the top, summary figures highlight headline numbers such as pages printed, the proportion printed in colour, the number of jobs and active users. Below, charts break printing down over time and across your fleet.