
Reports
Reports produces formatted, printable reports on print activity across your organisation. Reports are grouped into tabs by subject; you only see the tabs your role allows. Choose a report to open it in the report viewer, where you can read it on screen, export it, or email it.
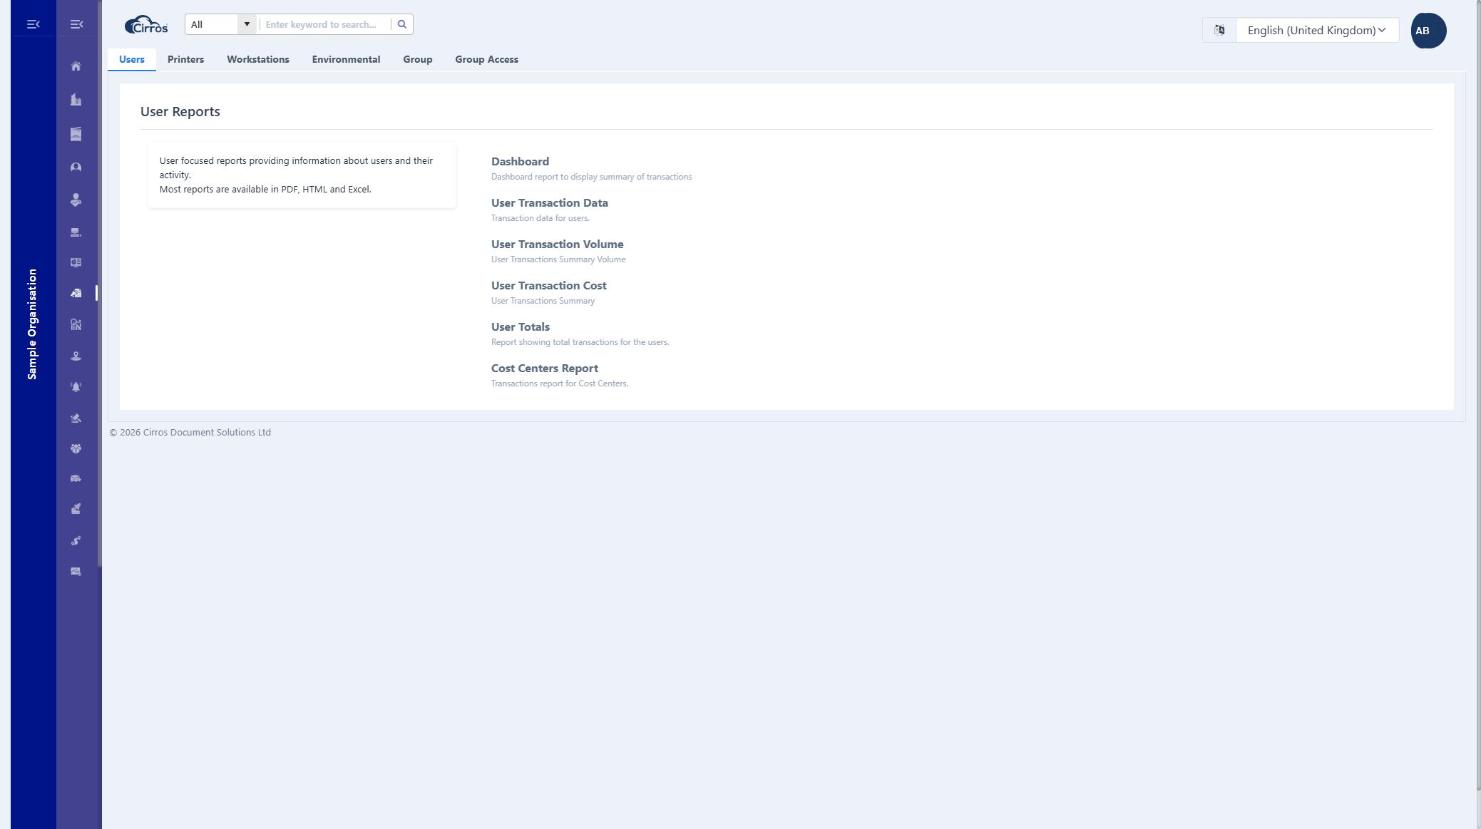
Report groups
| Group | Reports available |
|---|---|
| Users | Dashboard (summary of transactions), User Transaction Data, User Transaction Volume, User Transaction Cost, User Totals, Cost Centers Report. |
| Printers | Dashboard (printer), Printer Transaction, Printer Usage, Device Totals. |
| Workstations | Dashboard (workstations), Customer Workstations. |
| Environmental | Environmental Dashboard. |
| Group | Organization Data. |
| Access Group | Group Access. |
Opening and reading a report
- Choose a tab (for example Users or Printers), then click the report you want.
- The report opens in the viewer. It is interactive — you can scroll through pages and zoom in or out.
- Reports are scoped automatically to your organisation (and, for partners, to the companies you manage), so you only see data you are entitled to.
Exporting, printing and emailing
- Use the viewer toolbar to export a report. User reports are available in PDF, HTML and Excel.
- Use the toolbar’s Send Mail option to email a report directly from the viewer.
- To print, export to PDF and print from your PDF reader.
Reports vs Analysis. Use Reports for polished, shareable documents to export or email. Use Analysis (next section) for interactive, on-screen tables you can sort, filter and drill into for a chosen time period.