
Analysis
Analysis is a set of interactive, on-screen reports for exploring how the print service is used. You choose a time period and a report; the data appears in a sortable, filterable table that you can export to Excel. It opens on the Device Usage report.
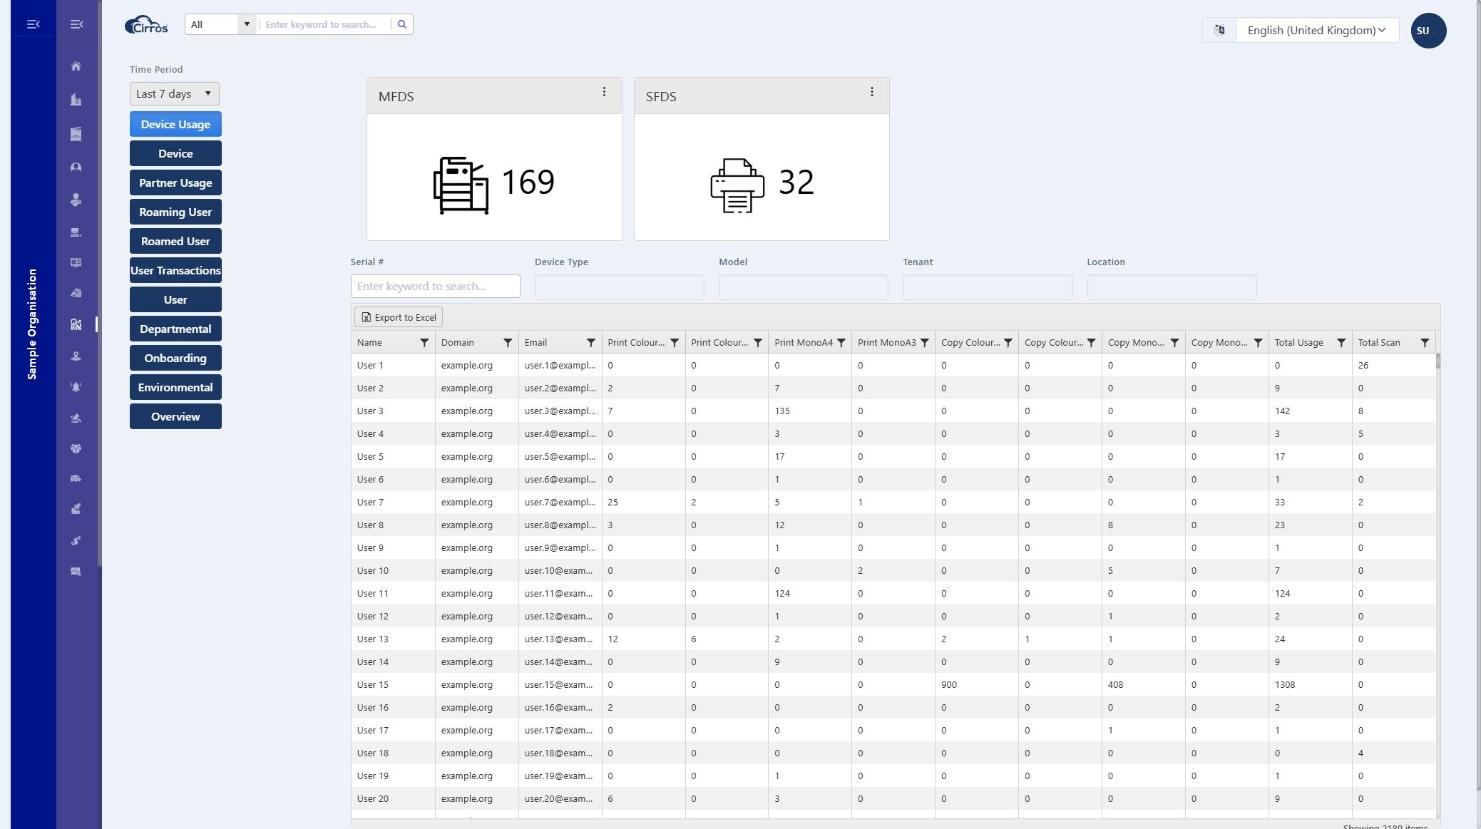
Choosing a time period
A Time Period drop-down at the top of the report list sets the date range for most reports:
- Last 7 days, Last 15 days, Last 30 days, Last month, Last 3 months, Last 6 months, Last year.
- Range — pick your own Start date and End date, then click Update to refresh the data.
The Onboarding, Environmental and Overview reports show current totals and do not use the time-period selector.
The Analysis reports
| Report | What it shows |
|---|---|
| Device Usage | Usage on one device, broken down by the people who used it. Search for and select a device, then see each user’s print and copy pages (colour/mono, A4/A3), total usage and scans, with a licence summary for the device. |
| Device | A full asset list of your devices with their usage. For each device: serial, model, location and type, plus print and copy pages (colour/mono, A4/A3), total usage and scans. |
| Partner Usage | Shared-device usage between partner organisations — per company, the mono and colour pages it contributed as a roaming organisation, the usage by roamed users, and the resulting balance. (Requires View Partner Usage.) |
| Roaming User | Your users printing on devices outside your organisation. Select a device to see usage by the partner company where it sits, with counts of roaming devices and users. (Requires View Roaming User.) |
| Roamed User | External users printing on your devices. Select a device to see their activity by company of origin, with counts of roamed devices and users. (Requires View Roamed User.) |
| User Transactions | Every user’s total usage across all devices — name, domain and email, with print and copy pages (colour/mono, A4/A3), total usage and scans. |
| User | All the devices a chosen user has used. Search for and select a user, then see each device (serial, type, model, tenant, location) and that user’s usage on it. |
| Onboarding | Adoption per organisation: users in the system, active logins, suspended users and activated cards. |
| Environmental | Sustainability impact per organisation: records deleted (by user and by system), and trees, CO₂ (kg) and energy (kWh) saved. |
| Overview | System growth month by month: number of MFDs, SFDs and users, mono and colour volumes, and the split between print, copy and scan. |
Selecting a device or user
The Device Usage, User, Roaming User and Roamed User reports ask you to pick a specific device or person first. Start typing in the search box (at least three characters) and choose from the matches — devices are listed by serial and location, users by name and email. The report’s details and table then fill in for your choice.
Working with the data and exporting
- Every Analysis table can be sorted, filtered, resized and reordered, just like the other lists in the dashboard.
- Click Export to Excel above a report to download the full results as a spreadsheet.